Auto Salvage Monthly:
Market Trends and Drivers Behind Purchasing Behavior
June 2022
Happy Wednesday, everyone. I hope your week is starting right, and this email finds you in an air-conditioned space.
Salvage returns continue to follow the wholesale market closely and operate in anticipation of changes in retail pricing. In May, the overall wholesale market continued to climb. The last week of the month saw the Wholesale Price index cross to 1.01, capping a 10-week rise and bringing wholesale vehicle prices to their highest point this calendar year (bottom left). Vehicle purchases at the salvage auction have followed closely. The average initial high bid at auction is up 0.7% from the first week of the year ($4208) to the last week of May ($4241). Although this is a nominal increase in salvage returns year to date, the salvage market has seen a 19.6% increase in an initial average high bid since week 12.

However, despite the overall increase, the week-over-week rise tapered significantly over the last 30 days. Some vehicle segments saw a decrease in wholesale price. The graph below depicts weekly price changes by vehicle class. Trucks and SUVs saw slight weekly price increases, while cars saw a weekly pricing decrease through May (light blue band below). Because wholesale pricing changed inconsistently across vehicle classes in this short-term period, inventory distribution greatly impacted realized salvage returns. Insurance providers across the industry with more significant inventory distributions of passenger cars compared to other vehicle classes experienced a decrease in salvage return. In contrast, providers with more significant allocations of trucks and SUVs experienced a nominal salvage return increase.

Although the rate of change in weekly pricing is often different by vehicle class, movement in opposing directions is uncommon. This resulted in greater variance between expectation and result for some of the vehicles managed by MAST through auction, increasing rejected bids at auction and a declining period of rerun success. May did not see rerun success fall below 88%, and we have already seen that trend correct in the early weeks of June, but we will continue to monitor auction performance to minimize loss at auction closely. In the interim, June reports will likely show increased reimbursed losses from MAST.

In the future, in June, wholesale vehicle values and salvage returns will likely continue to rise, but slowly, depending on the vehicle class segment. In years before the pandemic, seasonal adjustments in retail pricing began to recede in May and continued through July. As long as inventory levels remain low across all channels (new, used, and wholesale), we will likely continue to see prices increase slowly until 2023 model year vehicles are released en masse.
In the meantime, here is a summary of the auction return results for May:
3,293 Total Vehicles Sold with a gross return of 27.3%
$1,518,775 in auction increases realized for an increase to gross (MAST factor) of 2.46%
Average gain of $980.49 per initial rejected bid and a success rate of 92.4%
$5,433,099 cumulative net return dollars (after MAST investment) realized YTD for 2022.
Auction Management Wins of the Month
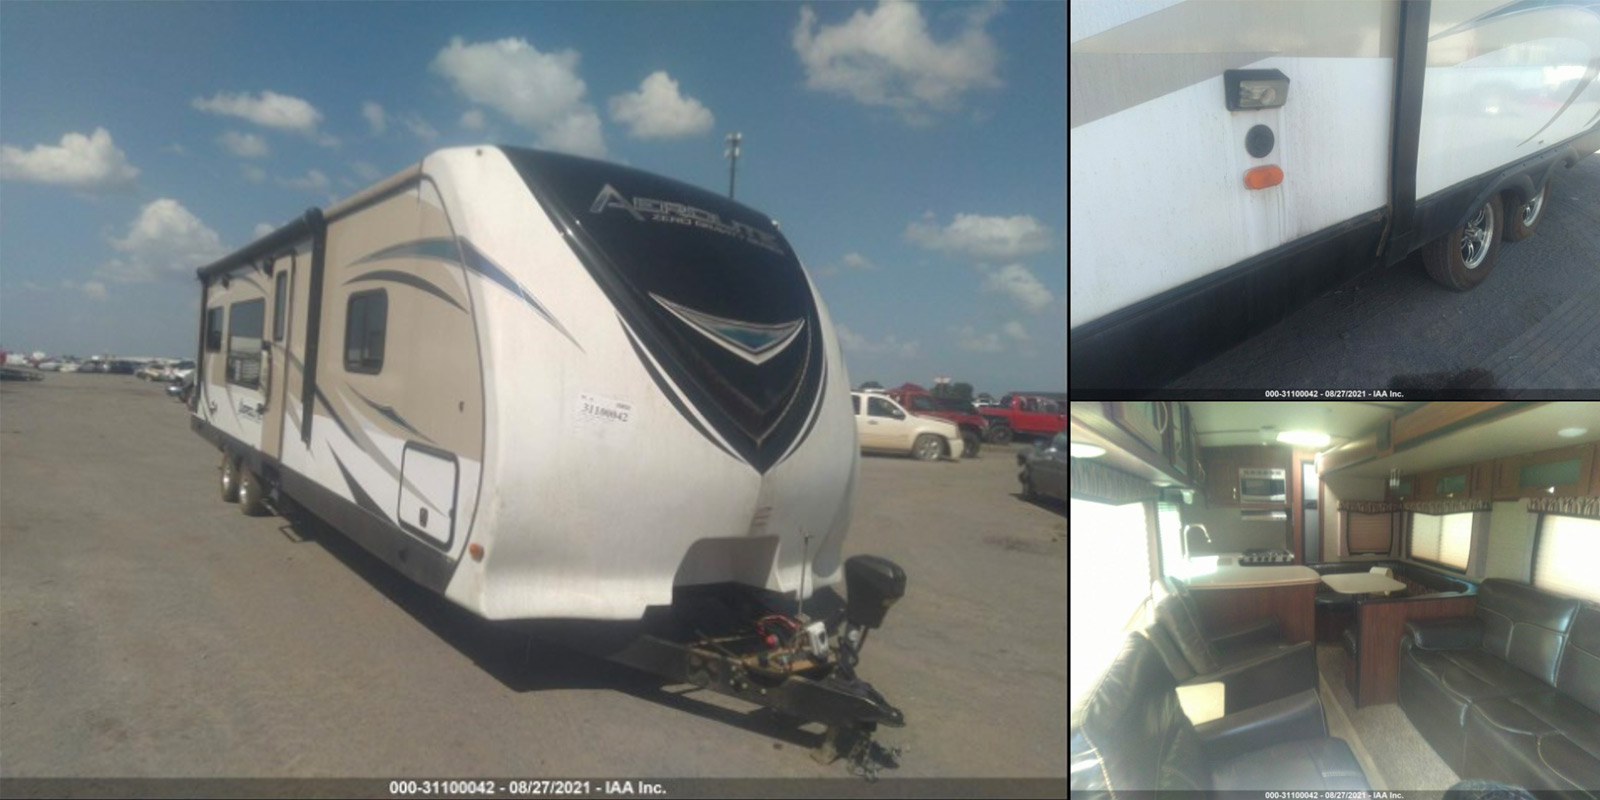
Including similar makes in a comps search leverages accurate expectations. With as much diversity across travel trailers, filtering on exact make/model often will not produce comparable salvage to anticipate value confidently. Alternatively, expanding your search parameters to include similar makes is an efficient way to identify multiple comps to base a decision on. Unfortunately, most market analysis tools limit results by filtering out specific makes/models. As predicted, an attempt to identify comps on this flooded 2017 Dutchman Aerolite yielded no results. A cross-comparison search was conducted, filtering only on year, vehicle class, and loss type. This time thirteen examples of 2017 flooded travel trailers were returned. The additional information shaped our projection, and a 1.4% accuracy variance on expectation vs. outcome was achieved.
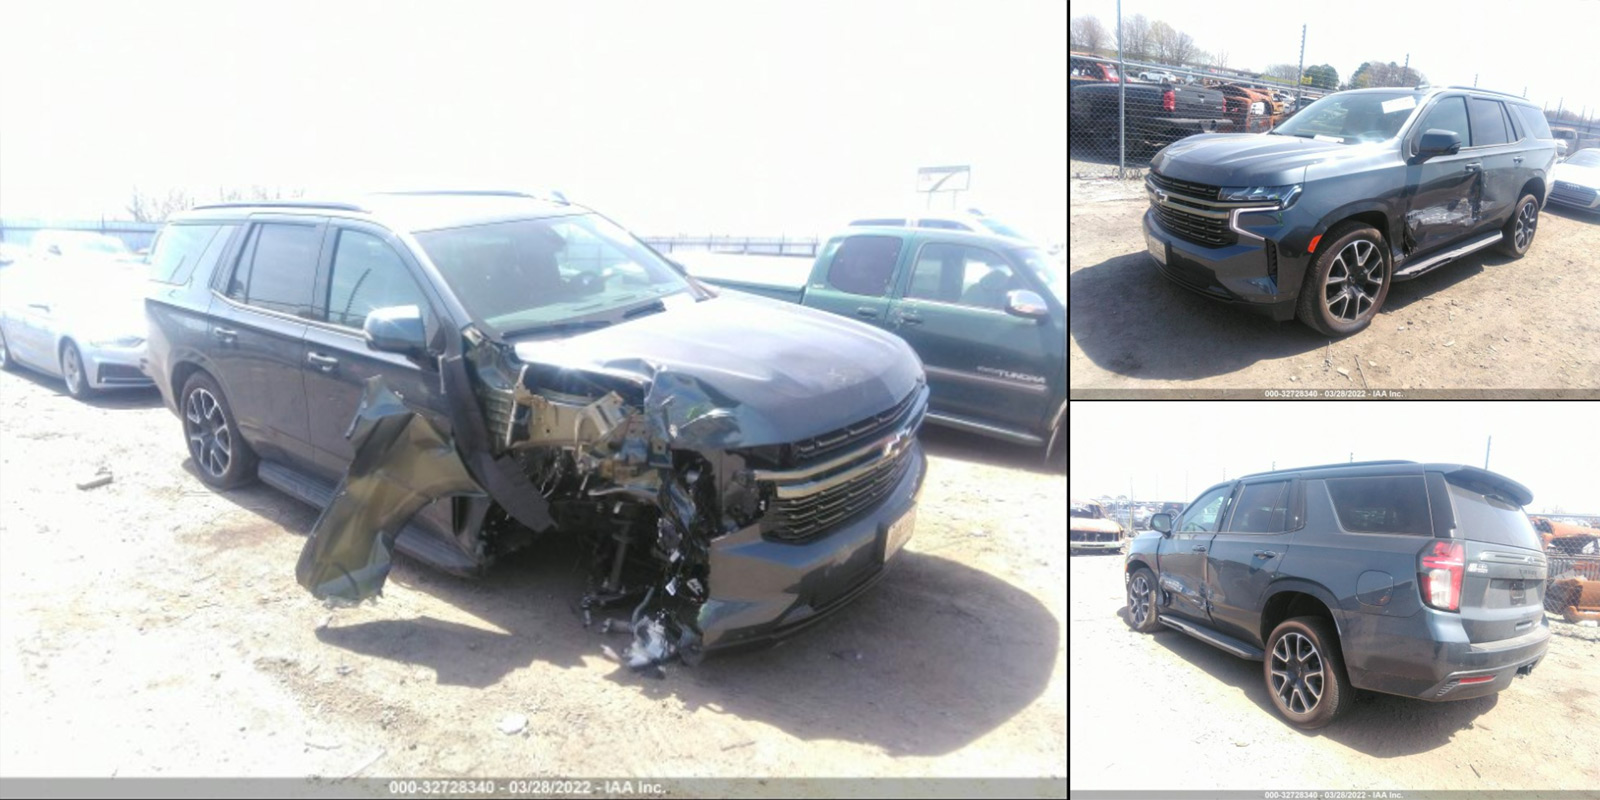
Short cycle comparisons will expose low bids in a volatile marketplace. While the industry witnessed an elevated salvage market for the last six quarters, the market is correcting in 2022. A slow, week-over-week reduction in purchase price is apparent. However, this 2021 Tahoe RST is a perfect example of how external factors create inconsistencies. As illustrated in the graphs above, fixating on sales segmented by vehicle class exposes an opposing pricing trend across trucks and SUVs relative to the general market. When gauging salvage expectations focusing on recent auction sales is equally important as identifying comparable units. Doing so will account for short-term market fluctuations, and better indicate today’s value. The initial run brought 41.3% of ACV. Historically speaking, a relatively strong bid for the level of damage on this Tahoe. However, pre-set expectations based on recent market sales flagged this as a low offer and set up a negotiated sale opportunity adding $6,000 to the final sale price, 48.8% of ACV.
If you are anticipating an owner-retain conversation or dealing with a borderline constructive total, we encourage your representatives to email us at [email protected] for a detailed quote specific to the loss vehicle’s make/model.
