Auto Salvage Monthly:
Market Trends and Drivers Behind Purchasing Behavior
May 2022
Happy Wednesday, everyone. We’re halfway through the week! April results were solid across the industry. However, returns against past claim settlement values make for a mixed bag of impressions for the last 30 days.
On the whole, purchase prices in the wholesale market and salvage auctions increased during April. For six cumulative weeks, since the end of March, the wholesale pricing index steadily climbed (below left). A Q1 decline followed by a Q2 rise is a trend we have not seen since 2019 (pictured) and reflects a vehicle supplier’s belief that seasonal consumer purchasing behavior is back in 2022. As a result, wholesale pricing is climbing in advance of anticipated consumer demand. That pricing strategy in the wholesale market directly correlates with salvage auction purchases as rebuilders and recyclers bid with future pricing in mind. The average price of salvage vehicles increased 6.5% across the industry from the first week of April (average initial auction purchase of $4250) to the last week ($4527, below right).

That expectation of increased consumer demand appears substantiated. In April, used retail inventory average days on lot dropped from 45 days at the beginning of April to under 36 for the first time in seven months (below). Average days on a lot is a representative measurement of consumer demand. A sharp decline in April, as we have seen, suggests that vehicles are not only selling but selling very quickly. With increased consumer demand comes an opportunity to hold the line on market expectations for salvage valuation. We saw an initial bid rejection rate of 44.0% industry-wide in April. That is significant compared to a cumulative initial bid rejection rate of 41.8% for all MAST-represented clients in Q1. An uptick in consumer demand and auction interventions from the MAST team means significant increases in gross return lift. The gross return percent increase (MAST factor) was 2.55% industry-wide, with an average auction increase of $1021 per auction intervention. That’s a very high degree of impact over a short period.

However, despite the rise in salvage purchase prices, claim settlement recovery feels like it’s continuing to fall. Salvage auction prices have been up over the last 30 days. Still, when those recovery figures are being measured against past claim settlement prices, gross return percentages are noticeably dropping across the industry. Consider the graphic below that compares salvage auction returns in dollars (below left) to salvage auction returns as a percent of claim recovery (below right). Even though purchase prices climbed through April, the recovery relative to ACV feels like a continued salvage market decline though actual purchasing behavior would suggest otherwise.

With an industry average cycle time from assignment to the sale of 88.5 days, the high auction returns we are experiencing today were measured against total loss settlements three months ago. From February 1st to April 1st, according to CarGuru pricing trends, used retail pricing fell 0.6% (below). This would suggest many claims organizations were paying more for a total loss three months ago than they are currently. The rise in salvage purchase prices has not offset that increase in claim payment from 88.5 days ago. The result is a perceived gross return % decline through April for many providers.

In the future, in May and June, we should continue to see elevated salvage purchase prices as vehicle inventory volume is still depleted and consumer demand is expected to increase. Since claim settlement values subsided a bit towards the end of Q1 (as suggested by the CarGuru used retail pricing index), the high purchase price of salvage measured against reduced claim payout will likely translate to inflated gross return % figures for May and June. We will continue to evaluate salvage against anticipated market purchase prices and build future projections into our salvage quotes.
In the meantime, here is a summary of the auction return results for April:
3,372 Total Vehicles Sold with a gross return of 28.1%
$1,515,550 in auction increases realized for an increase to gross (MAST factor) of 2.55%
Average gain of $1,021.95 per initial rejected bid and a success rate of 94.3%
$4,269,624 cumulative net return dollars (after MAST investment) realized YTD for 2022.
Auction Management Wins of the Month
CAT events are stressful. Simple tools can help.
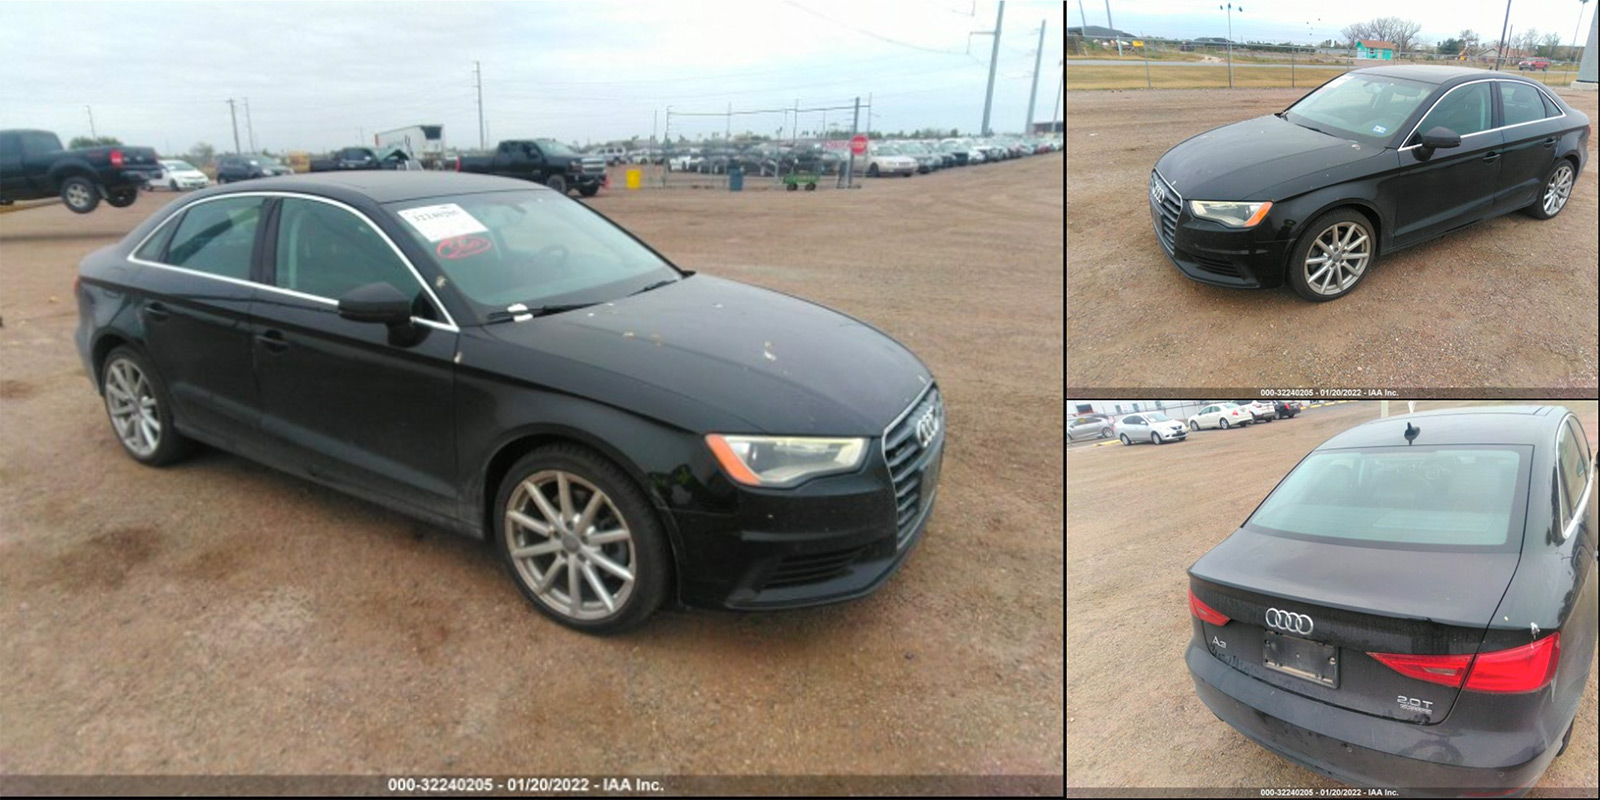
A major CAT event means heavy claim volume, anxious policyholders, and stressed-out adjusters. Hail events tend to mean all three of these issues at once, and because hail losses bring high salvage returns, total loss thresholds are often met sooner than later. Suppose your people inspect and settle losses in remote locations. It may not be possible to access an online tool for salvage projection, or remote connectivity bandwidth may make that access painfully slow. A simple tool like a detailed chart breaking down salvage expectations by age and vehicle class might help your inspecting reps reach their decisions to total faster. But if that tool is going to drive your repair/replace decision, it had better be accurate. Claim settlement on this 2015 Audi A3 was assisted by a field tool suggesting an anticipated salvage return by class (passenger car) and age (7 years old) that resulted in a confirmed salvage recovery at auction with only a 3% variance from prediction to resolution. That variance was well within the constructive loss threshold the adjuster considered during the inspection. If your team doesn’t have a precise tool like that to assist with rapid field resolution, you can find one for free at getmycatmatrix.com.
Live to Ride. Ride to live… but don’t forget to do your homework first.
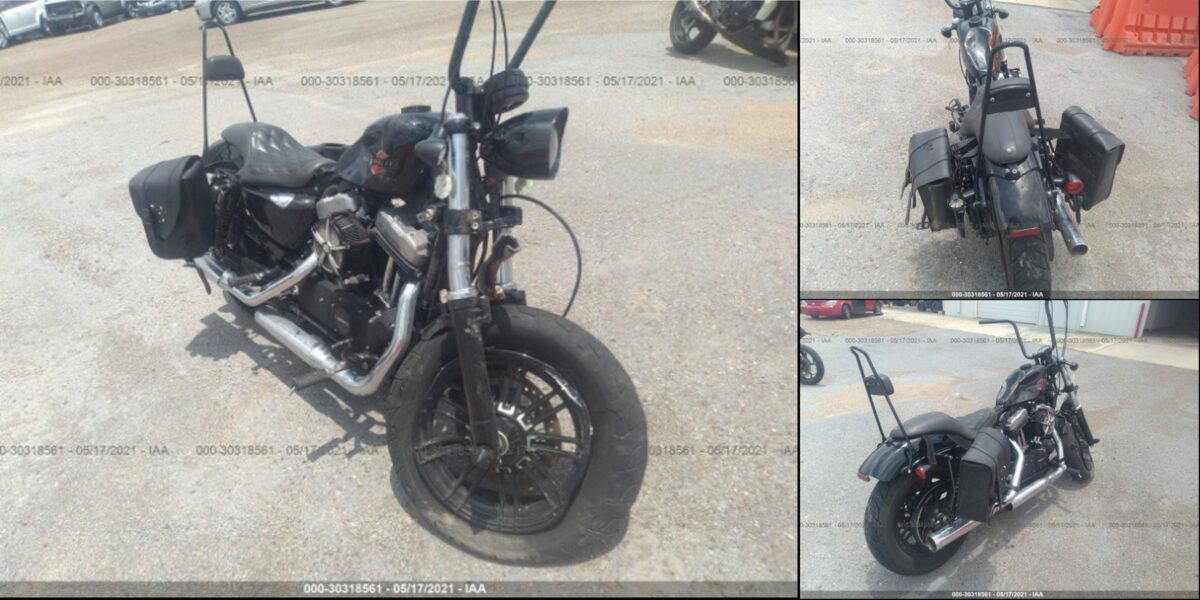
Summer season is upon us, and the toys are out to play. With more bikes on the road, your portfolio of motorcycle salvage assets will grow if you find these on your list of insurable vehicles. As those assets make their way to auction, salvage buyers will be looking for deals on rebuildable candidates like this 2019 XL1200 Sportster. Don’t be the discount salvage supplier. If you have a solid auction management process that centers on pro-active inventory review, short cycle market trends, and accurate salvage expectations, you can identify light auction results efficiently and produce auction lift that means measurable salvage recovery improvement for your team. An initial run through auction saw a final high bid of $2250. Not terrible, but not consistent with pre-auction research and current market trends. Rejection of that initial auction result led to a sale 24 hours later for $3450. Easy to spot and a $1200 improvement… just a little homework required.
If you are anticipating an owner-retain conversation or dealing with a borderline constructive total, we encourage your representatives to email us at [email protected] for a detailed quote specific to the loss vehicle’s make/model.
