Auto Salvage Monthly:
Market Trends and Drivers Behind Purchasing Behavior
February 2022
Hello and Happy Friday. This month in salvage news, we have an excellent visualization to share with you.
In our January monthly report last time, we discussed changes in used retail vehicle pricing as reported by the Manheim Used Vehicle Value Index. Specifically, we discussed how the negative used retail pricing trend in 2022 had slowed in November and changed directions in late December. Well, January finished with a 2.5% increase in the used retail pricing index compared to December (below, top). This suggests that the retail vehicle pricing trend has officially changed directions. Compare this pricing shift to the weekly gross returns on vehicles sold at salvage auctions during that same time (below, bottom).
")
The trend in gross return % is very similar to the movement in used retail pricing — which makes sense as the price of vehicles greatly influences the spending habits of salvage buyers. However, making real-time auction management decisions that align with buyer expectations can take some effort. Salvage buyers are not fickle. Most of them are practiced in market volatility, and many are very attuned to the demand of their customer base, as they often focus on single manufacturer lines or vehicle class segments. Their opinions of future vehicle value do not flip overnight. It takes a prolonged movement in vehicle pricing to shift the salvage purchase price trend in the opposite direction. In the bar graph above depicting gross return %, the light grey line mirroring the retail pricing trend is a 30-day rolling average, and the entire graph is shifted approximately one month as compared to the retail pricing graph above it.
When salvage value does change, the market movement is rapid. An expectation of salvage value can change dramatically from month to month. The inability to move your expectations quickly with the market can lead to inaccurate decision-making at the auction, resulting in salvage assets selling for below market value or a rapid reduction in auction performance from one week to the next, resulting in a loss on the sale. We aim to ensure we accurately assess salvage value and move expectations as quickly as the market demands. One of the ways we detect pricing movement is by tracking retail and wholesale pricing trends. Still, December and January brought us a great visual example of one of the other important ways…
CAUTION: COOL VISUALIZATION BELOW:
")
The graphic above depicts buyer activity weekly at auction (across the industry) measured as the average initial bid offered relative to vehicle replacement value (ACV). This is not gross return %. Instead, it is the top bid received for all units on their first pass through the auction. Since late July, there has been a slow and steady decline in the initial high bids offered at auction — which we now know in retrospect loosely mirrors the trend in used retail vehicle pricing. Additionally, you can see the 30-day rolling average (in grey) for the same value and the 90-day rolling average (in black). For the most part, the short-term trend (30-day) and the long-term trend (90-day) follow each other closely when change is gradual. Initial bids offered from July to October fell consistently as retail pricing declined during those months. In November, however, initial bid activity fell quicker than before as the short-term trend (grey) separated significantly from the long-term trend (black). We interpret this as a period of overly conservative bidding relative to prior periods. As a result, the opportunity to increase auction performance is high (which is why November and December saw high rejected bid rates from our Analyst team). That window closed in January, and the opposite occurs as we enter early February. Initial high bids offered at auction are currently aggressive (higher than usual) relative to prior periods, suggesting less opportunity for auction improvement.
Assuming a very accurate impression of individual vehicle salvage value, measuring bid activity trends in this way allows for changing auction management efforts rapidly to align with salvage buyer interest. We don’t often see a sharp swing like this in a short 60-day period, and we wanted to share the insight that rolled out across our team in real-time last month. February should continue to see increasing auction performance (relative to months prior) and less auction intervention from us — which means a lower rate of initial high bid rejections.
In the meantime, we will continue to review all vehicles set for sale with near-term market expectations in mind. Here is a summary of January return results:
3,807 Total Vehicles Sold with a gross return of 24.5%
$1,577,980 in auction increases realized for an increase to gross (MAST factor) of 2.35%
Average gain of $827.45 per initial rejected bid and a success rate of 93.0%
$1,215,275 cumulative net return dollars (after MAST investment) realized YTD for 2023.
Auction Management Wins of the Month
As the retail market begins to shift upward in 2023, savvy buyers shop for rebuildable gems.
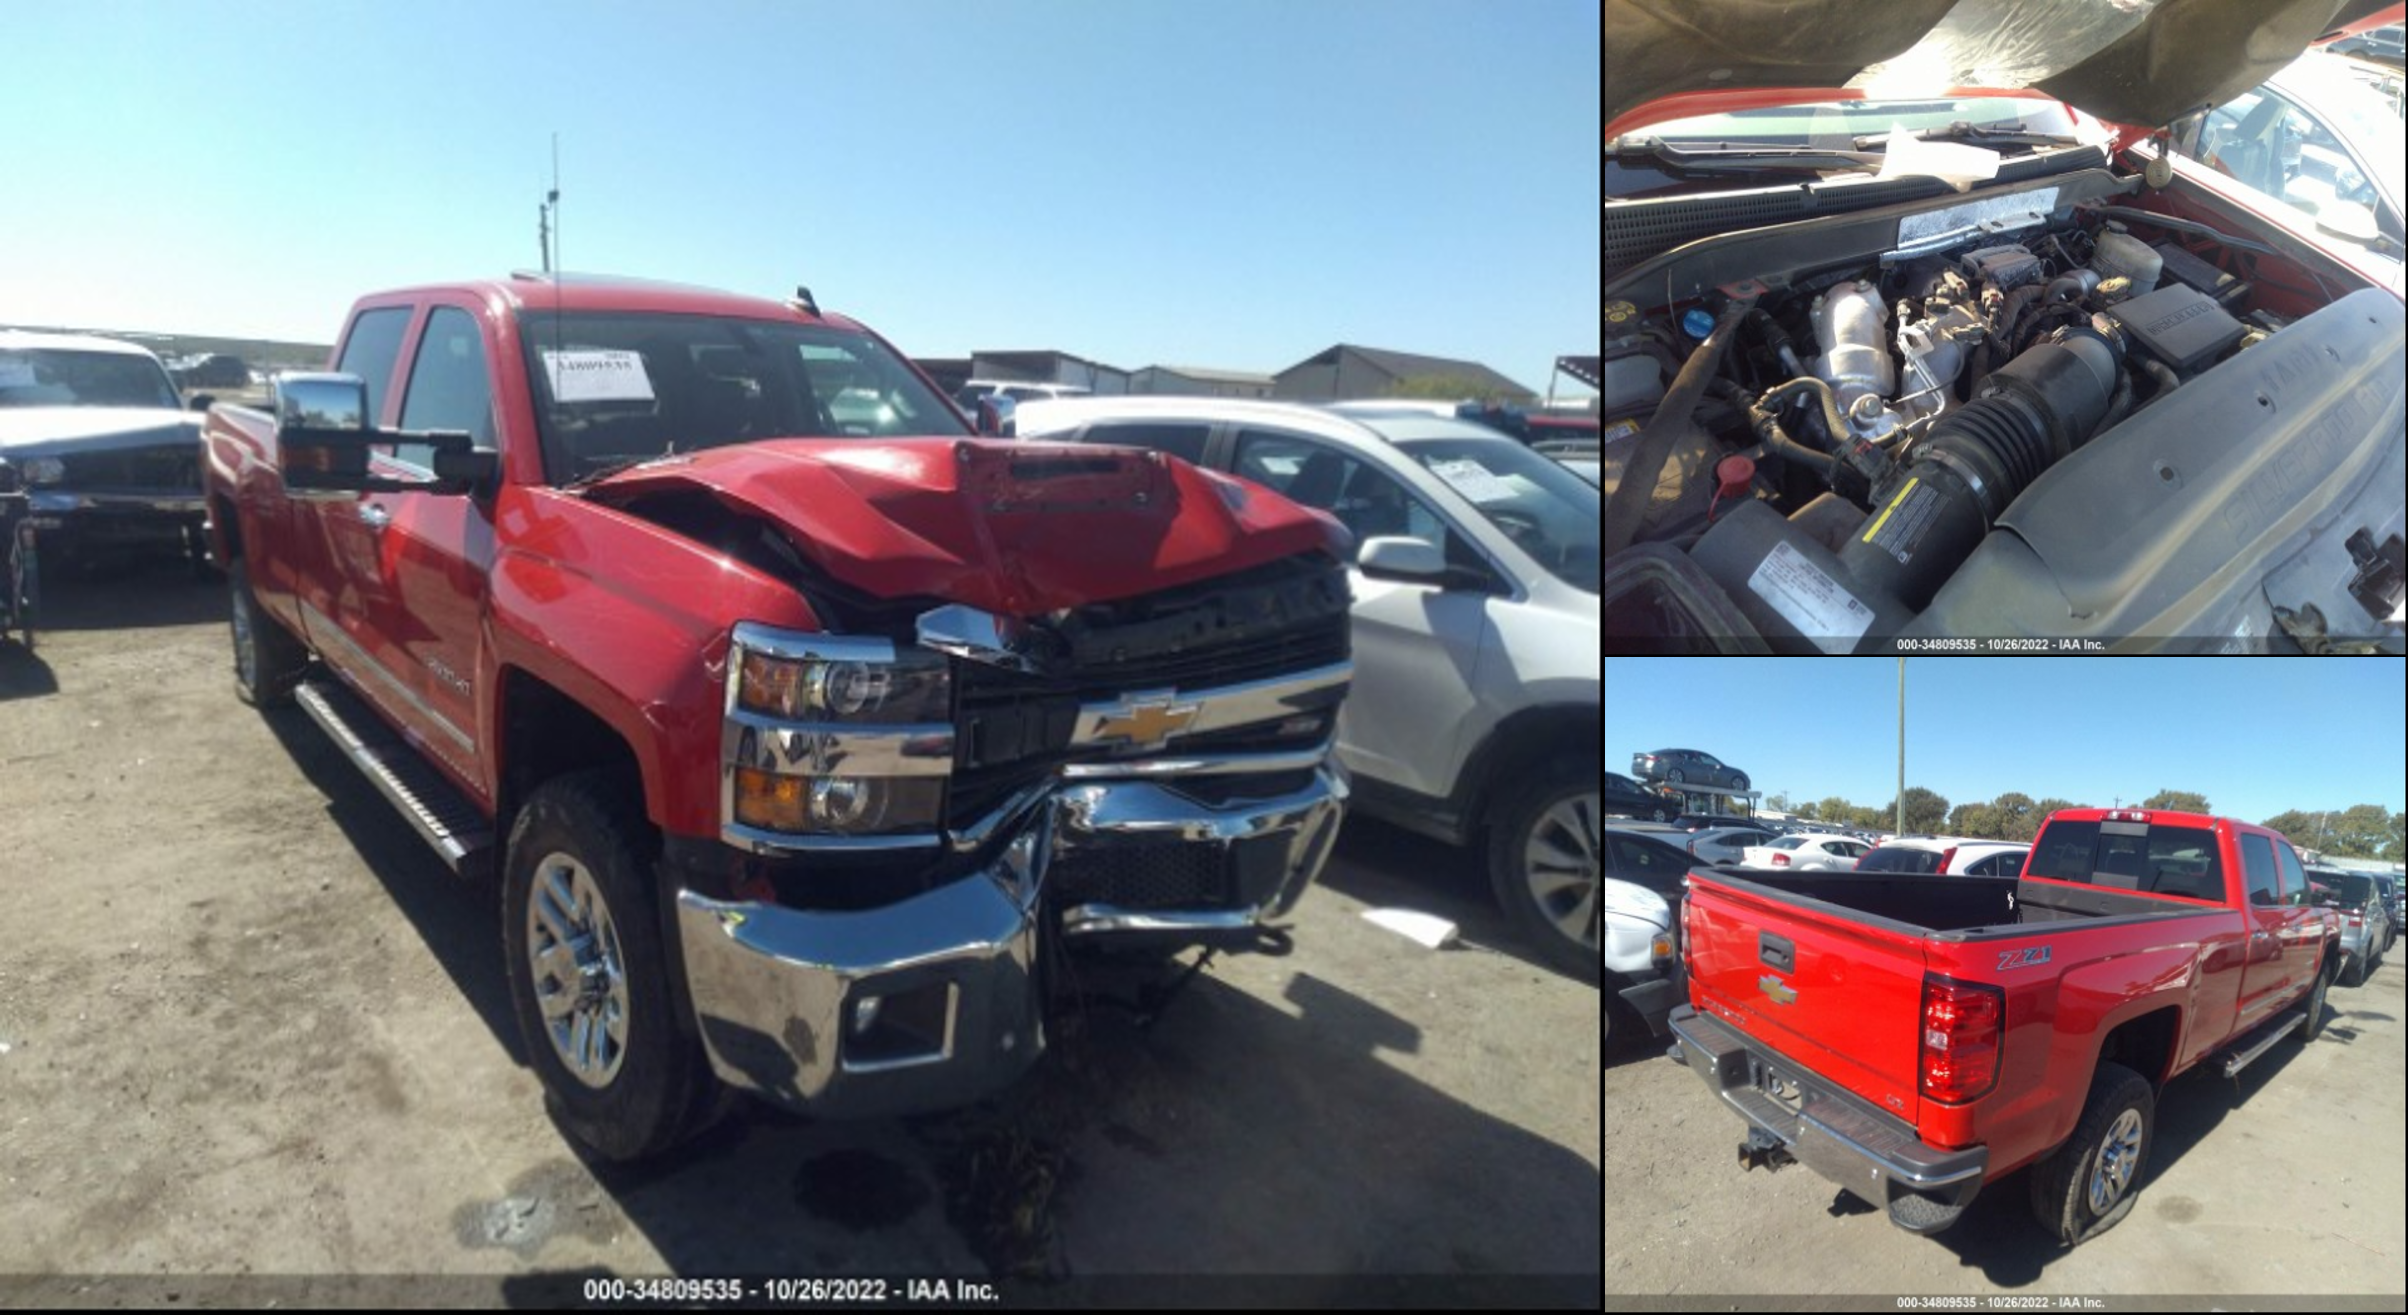
This recovered theft hit the auction with front end damage. On the first run-through auction, the bidding stopped at 34.4% of ACV, not far off of reasonable market value for a 2017 collision. However, a savvy salvage analyst also understands the demand this particular truck brings. A Chevrolet Silverado LTZ, Z71 package with the 6.6L V8 diesel and 4wd. When it comes to trucks, these are some of the most sough-after units. The truck market has been a strong performer throughout 2022, and selling in Texas only intensifies buyer demand.
Anticipating return expectations based on vehicle class and trim level and accounting for geographic marketability weighed against repair costs almost guarantees a more accurate salvage valuation in your break-even analysis. Ultimately this truck fell below the anticipated market value on the initial auction run. A few days later, it sold to an online bidder at the original reserve and a $6,650 increase to the final recovery.
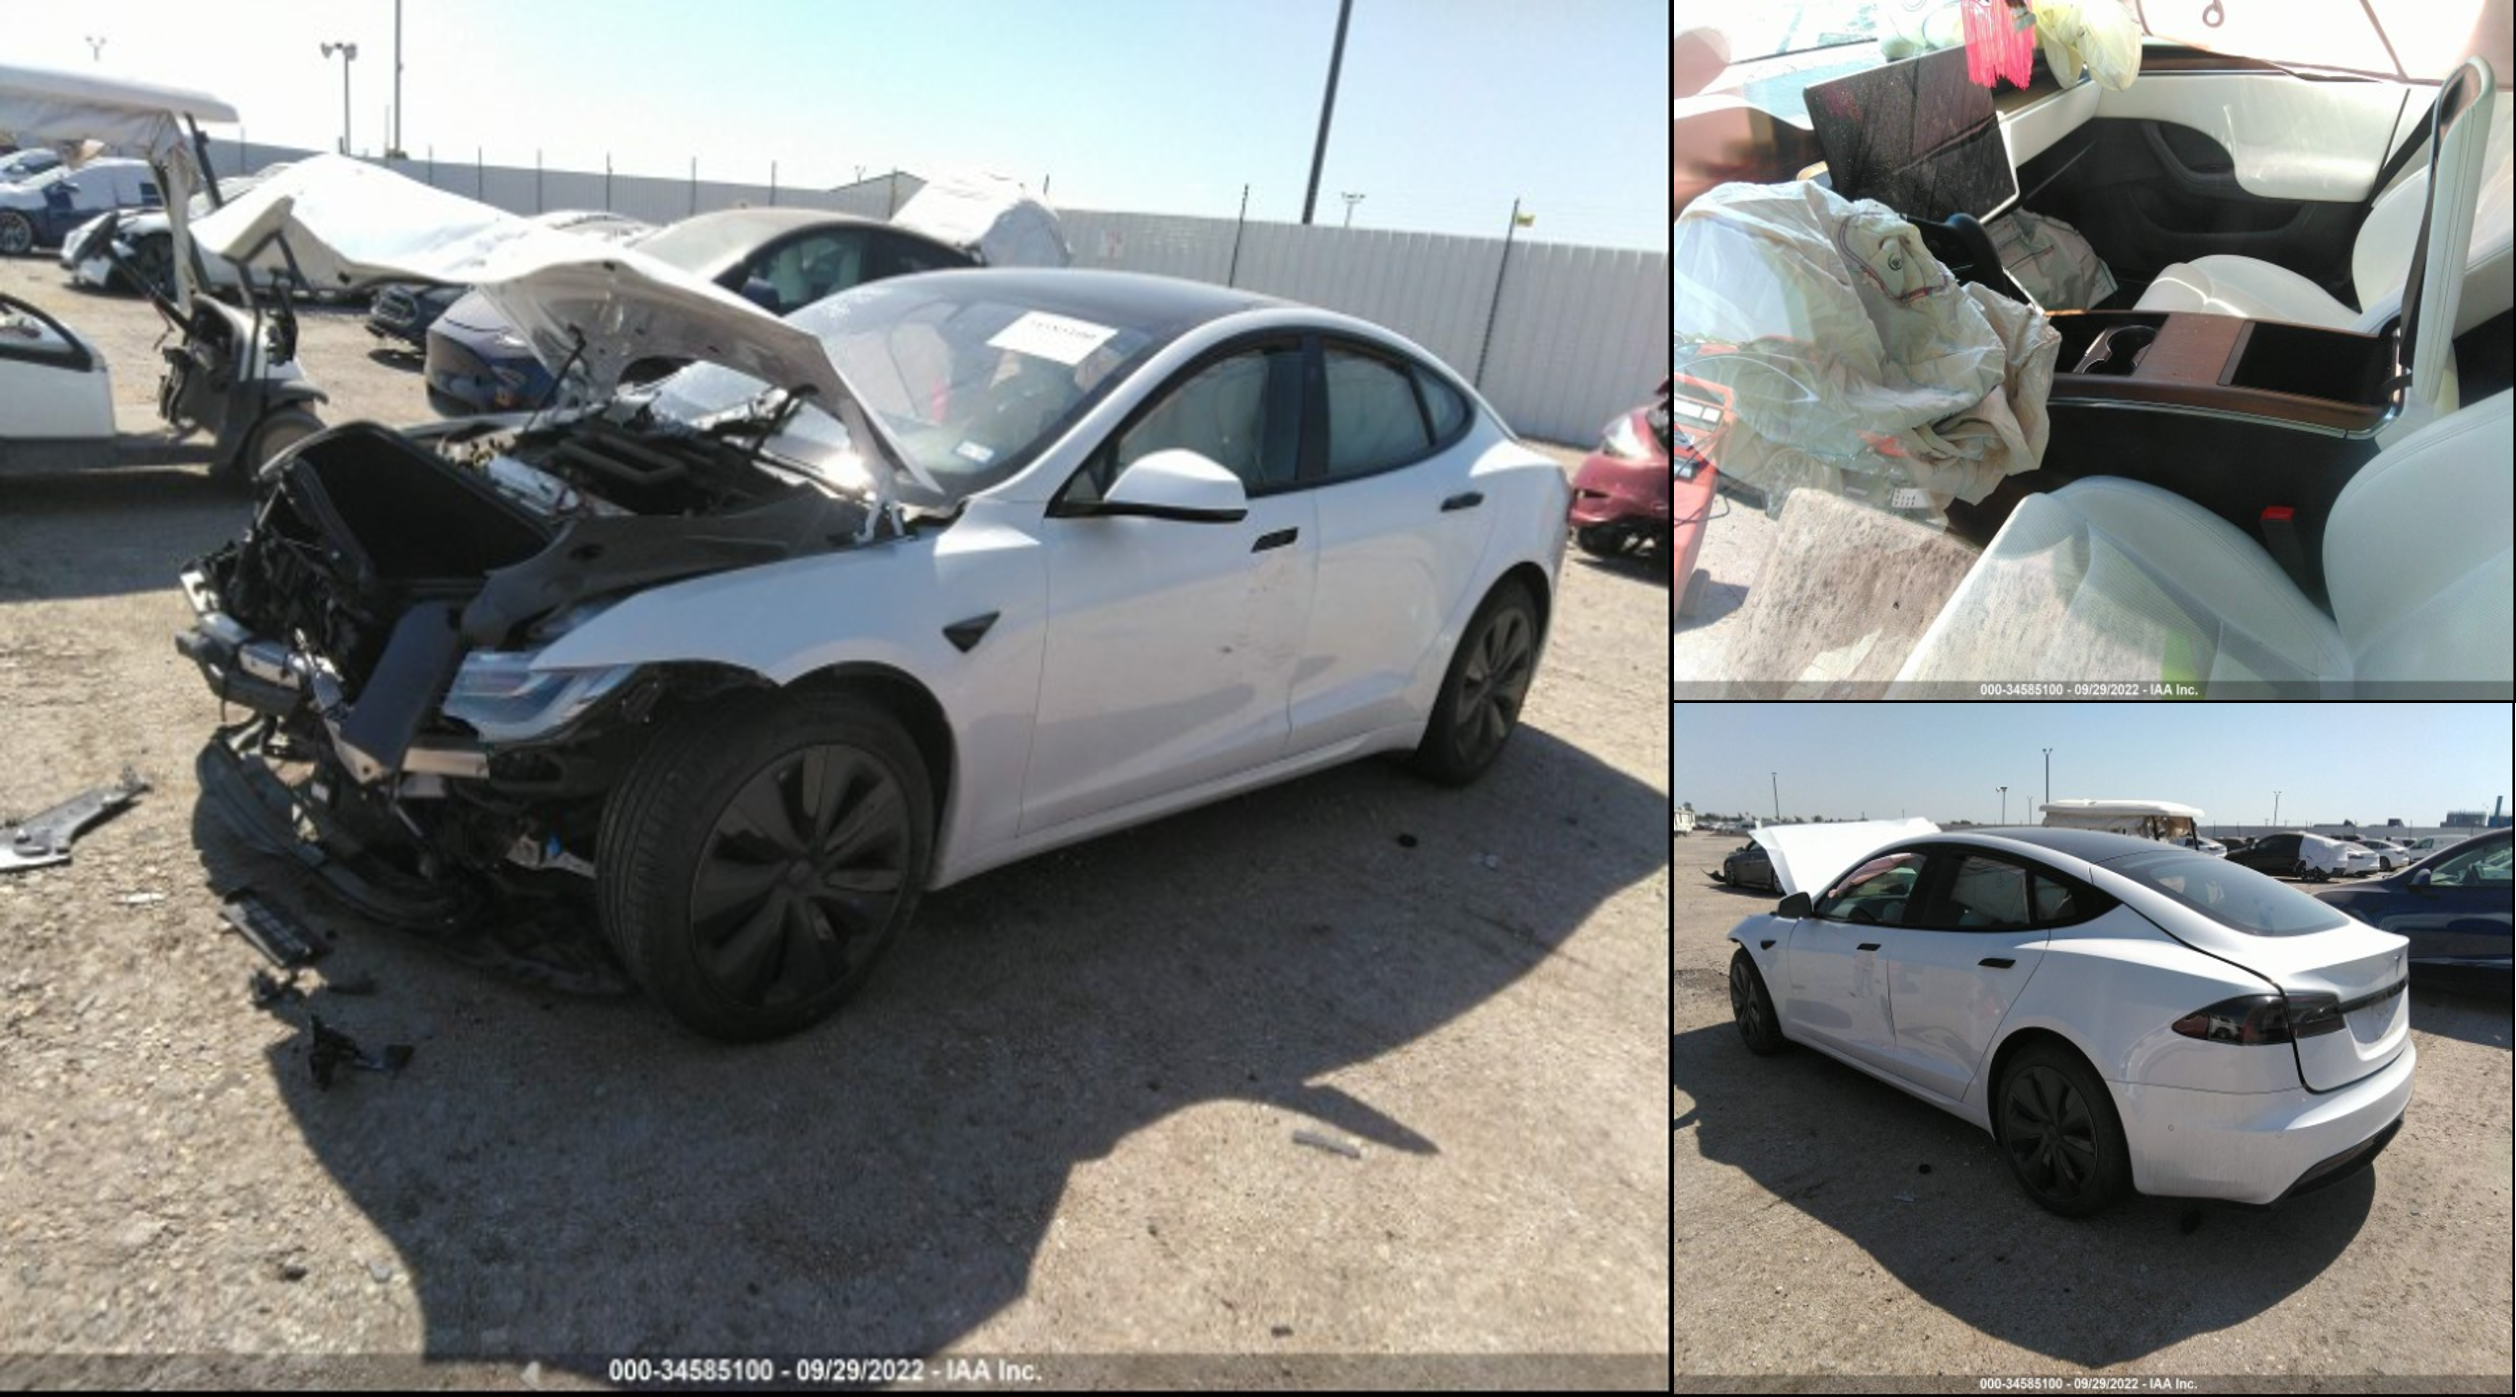
Comparable EV units are increasing at the auction yard, but the salvage value assessment presents unique challenges.
EV models are becoming more prevalent in the auto industry. According to KBB, while retail sales fell 8% in 2022, the EV segment grew by 65%. Despite that increase, there is still much to understand from the rebuilders’ perspective. Although the competitive landscape for electric vehicles has grown, Tesla still holds 58.3% of the market share, so it’s no surprise that quite a few end up at salvage auctions. This influx of comparable inventory in the EV segment has undoubtedly impacted the ability to anticipate salvage returns accurately. In this case, the unit has heavy damage to the front end that likely will lead to astronomical repair costs and parted out as a result. Understanding the value of those recoverable parts is where the salvage assessment began. An initial auction run capped out about $8,500 shy of researched expectations and fair market value. However, an additional $6K in recovery dollars was identified after a successful negotiation.
If you are anticipating an owner-retain conversation or dealing with a borderline constructive total, we encourage your representatives to email us at [email protected] for a detailed quote specific to the loss vehicle’s make/model.
